The representation problem
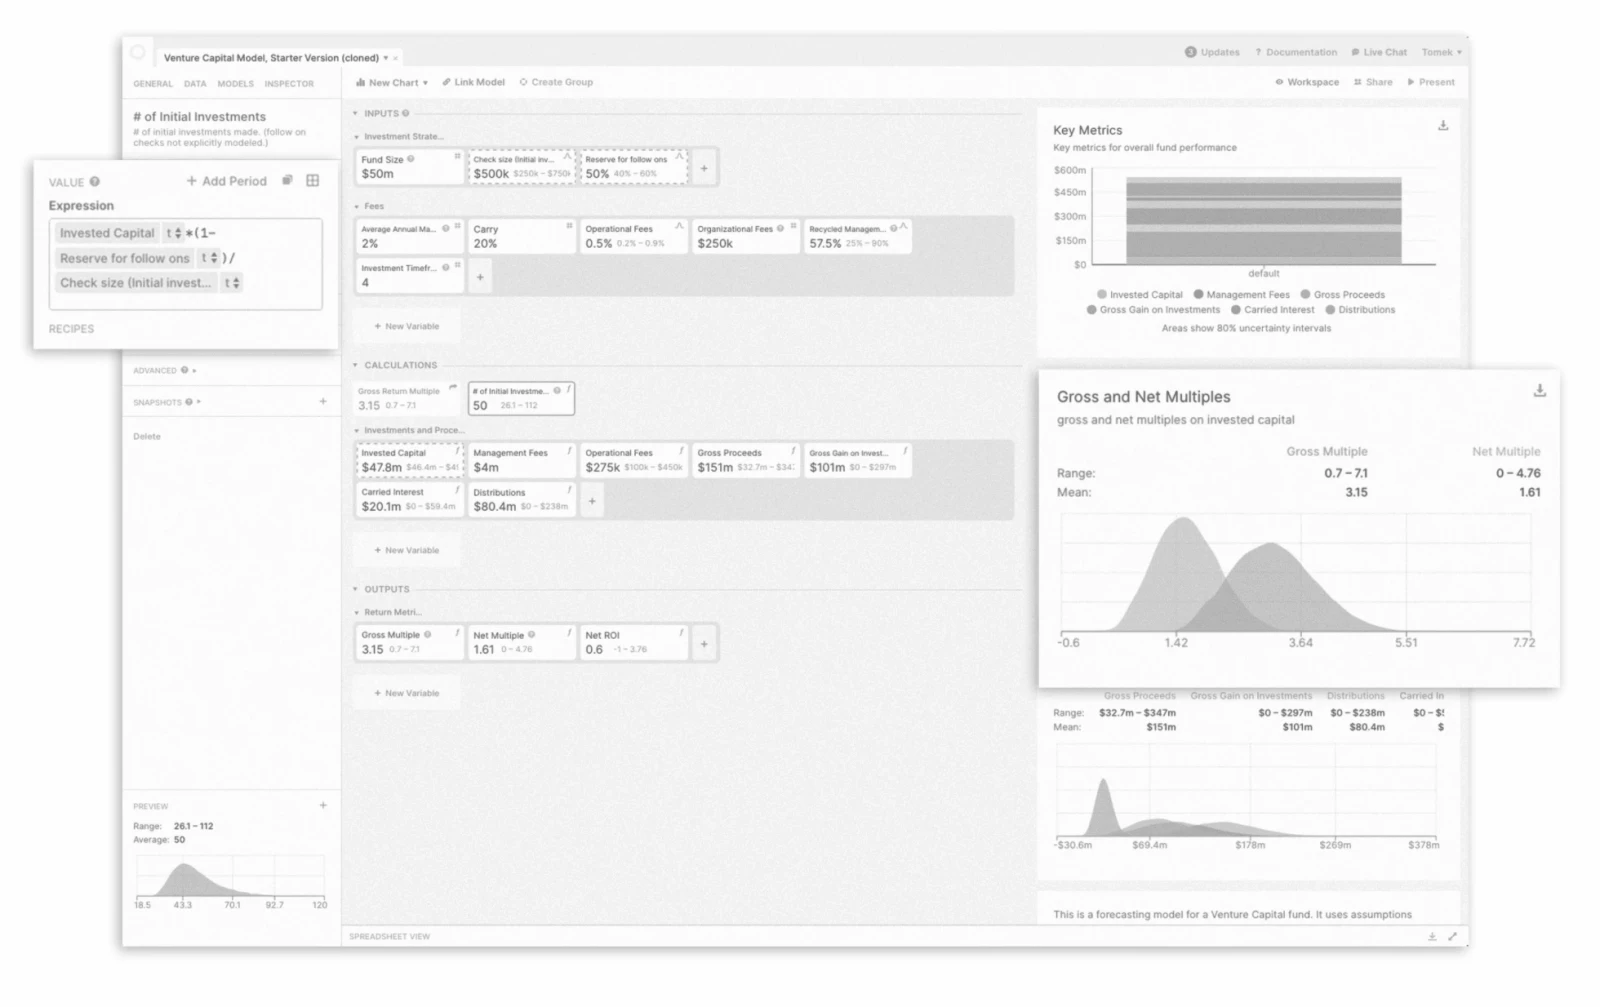
Variables used to be large rounded cards, each with its formula in a popover. For people used to spreadsheets, this made a model harder to read: neighboring values were out of view, references to earlier periods felt indirect, and many operations were hard to find.
How we explored it
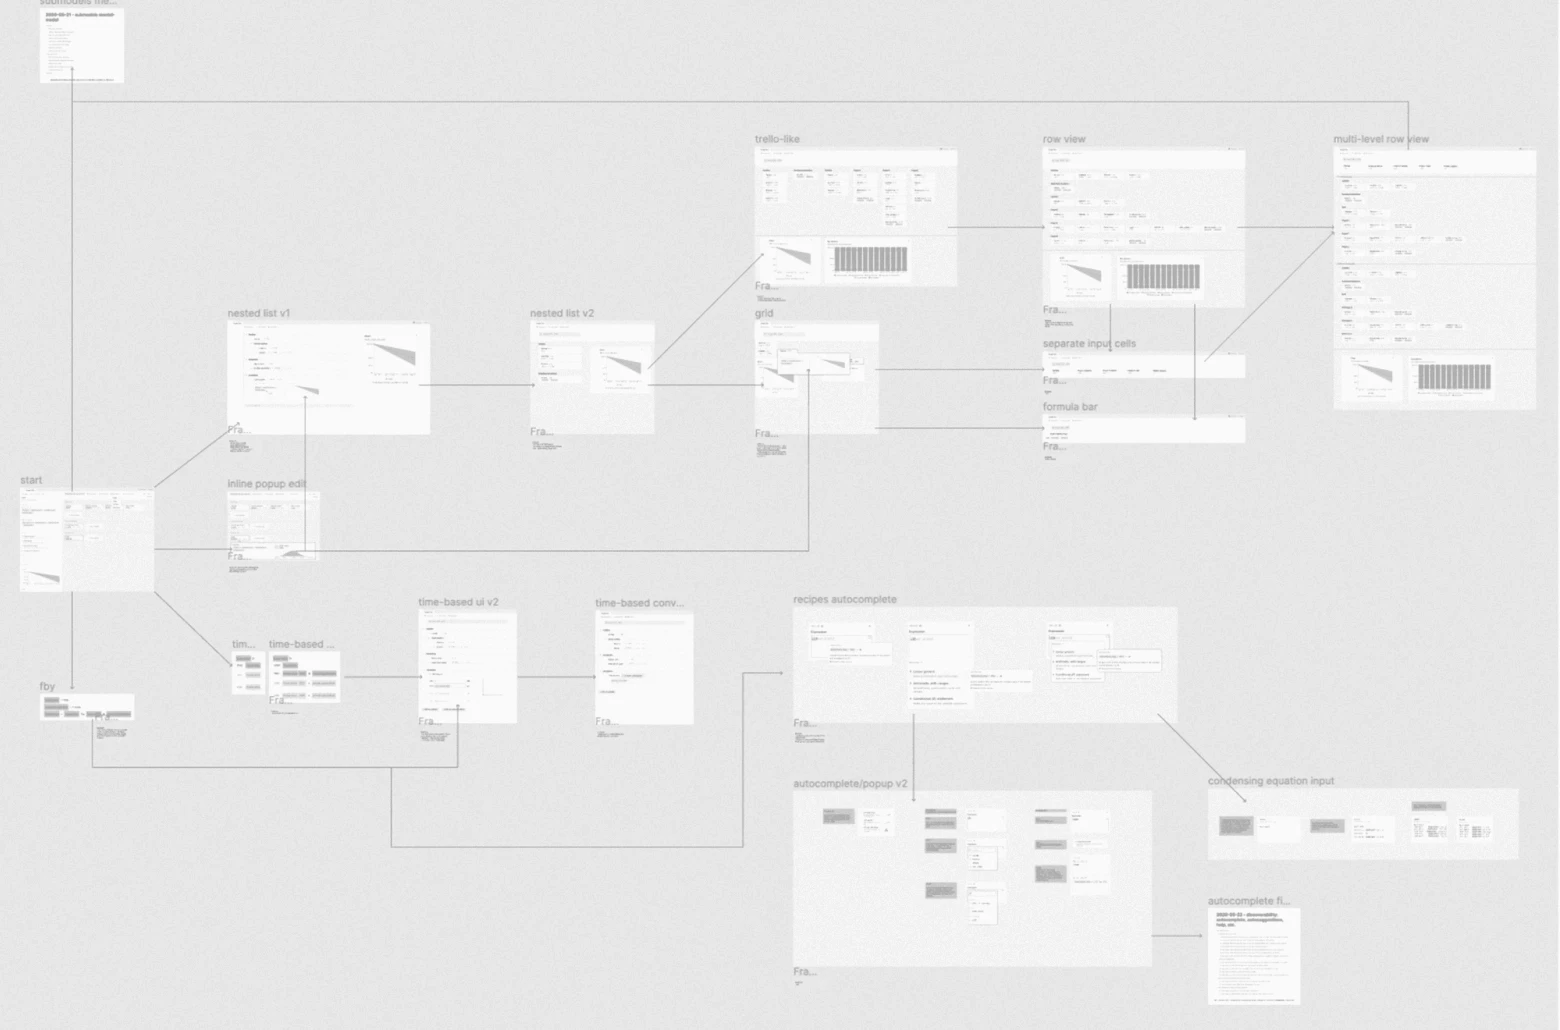
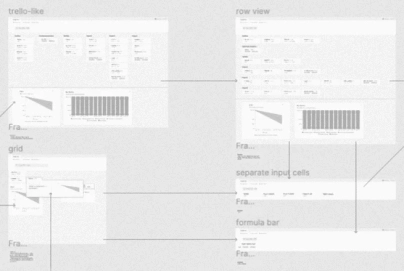
In the first workshops I learned how Causal runs its simulations, went through the more complex use cases and read user feedback on time-series modeling. We rebuilt the full user flow, element by element, and interviewed a small group of users about how they think of time in financial planning. Then came prior art, from research papers to other software, and many quick experiments in different directions — code sketches, wireframes, user flows — to test ideas and ask better questions.
The revised interaction model
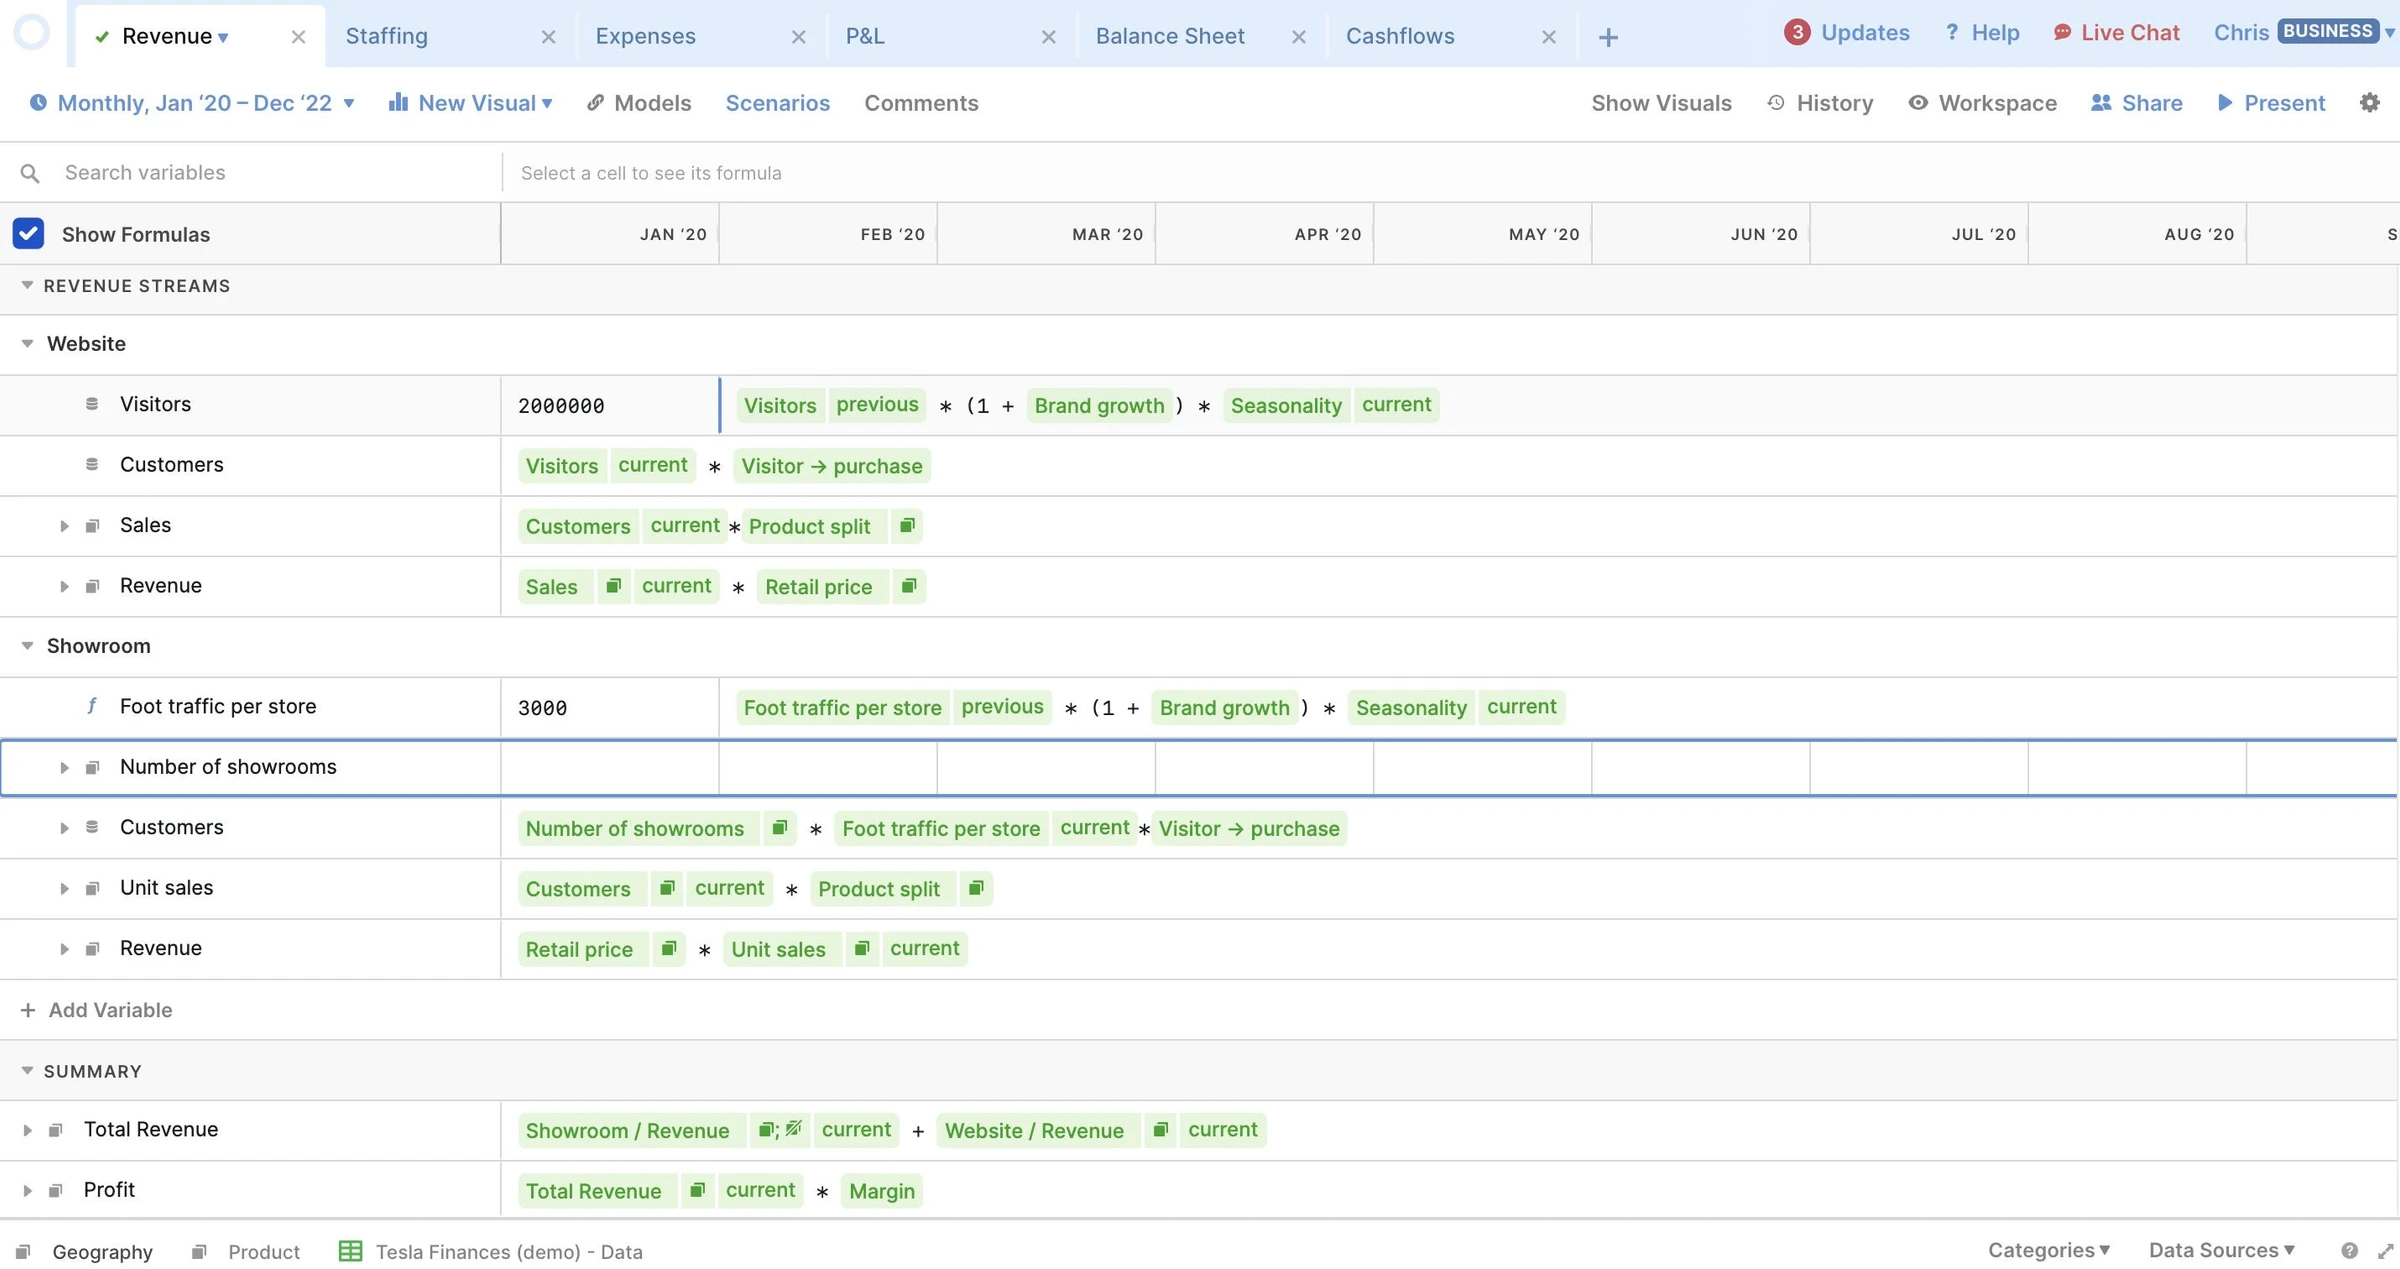
Variables now sit in rows, with time across the columns. You edit a formula where it is, and references to other variables appear inside it as small tokens. Editing and presenting are separate views of the same model. Neighboring values and earlier periods stay in view, the way people used to spreadsheets expect.
Three decisions
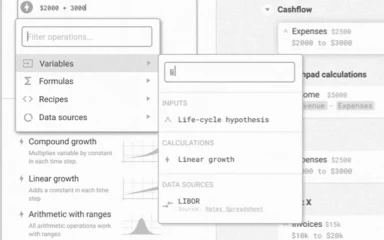
Formula assistance
Users could not tell which functions existed without opening the help, which knows nothing about what they are doing. Autocomplete and autocorrection now help with formula semantics, and a small menu at hand offers ordered, labeled templates.
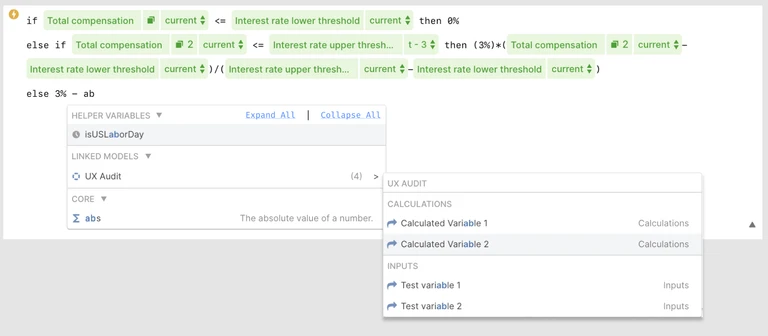
Time and previous values
In interviews, “prev” felt confusing, especially to people coming from Excel: it is indirect and hides the value it stands for. Time references became explicit — relative (previous, t-12), fixed (final) and ranges (t-6:t-1) — so a formula says which period it reads.
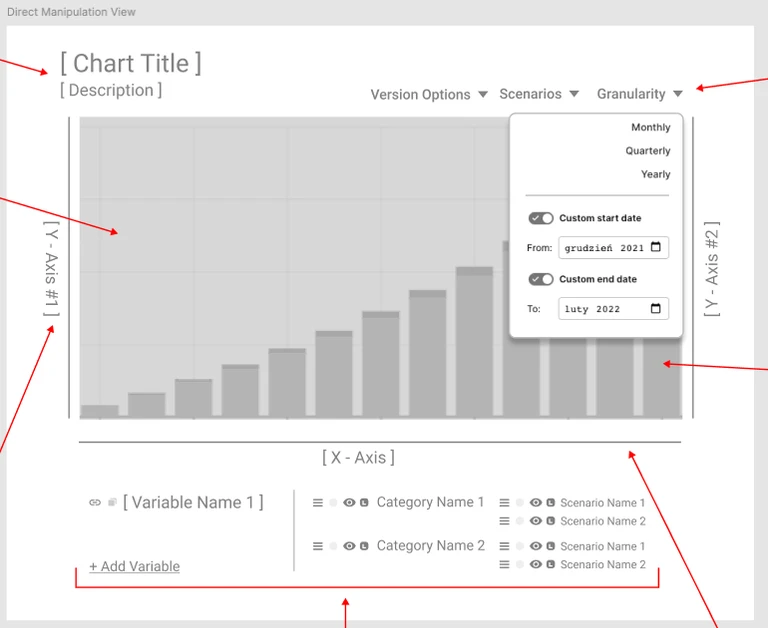
Charts
Any variable can be charted from its cell, or through a wizard with instant previews. On the chart, range selectors let you pick and compare periods directly.